A Look At Entropy Analysis
I have recently delved into firmware analysis to look for vulnerabilities and came across the vital concept of entropy used in visual firmware analysis. So what is it?
Entropy
Taking the definition from fourmilab, it is the information density or randomness of the contents of the file. In simple terms, it is the measure of the number of bits required to represent each character appearing in the file. Let’s say we have the following string
aabbccaaccbb
By looking at the patterns, we can say that the number of bits required to represent the whole string will be low as we can replace each pattern with a reduced number of bits. However, take a look at the following string.
abdcdabcdad
The patterns previously present are no longer there. This will mean that we will need a higher number of bits to represent the above string.
Ok, that’s all well and good, but how does this apply to firmware analysis. Well, using the above concept and identifying that compressed and encrypted data have much higher entropy than other data, we can distinguish the various regions of the firmware.
Before we start calculating the region based entropy, let’s calculate the entropy for the entire file using Shannon entropy. The formula is shown below.
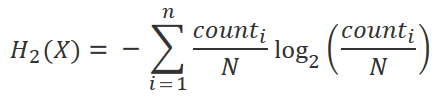
The same rewritten in python is shown below.
def information_entropy(data):
  # Create a counter for all the 256 different possible values
  possible_vals = dict(((chr(x), 0) for x in range(0, 256)))

  # Increment the counter if the byte has the same value as one of the keys
  for byte in data:
    possible_vals[chr(byte)] +=1

  data_len = len(data)
  entropy = 0.0

  # Compute the entropy of the data
  for count in possible_vals:
    if possible_vals[count] == 0:
      continue

    p = float(possible_vals[count] / data_len)
    entropy -= p * math.log(p, 2)

  return entropy
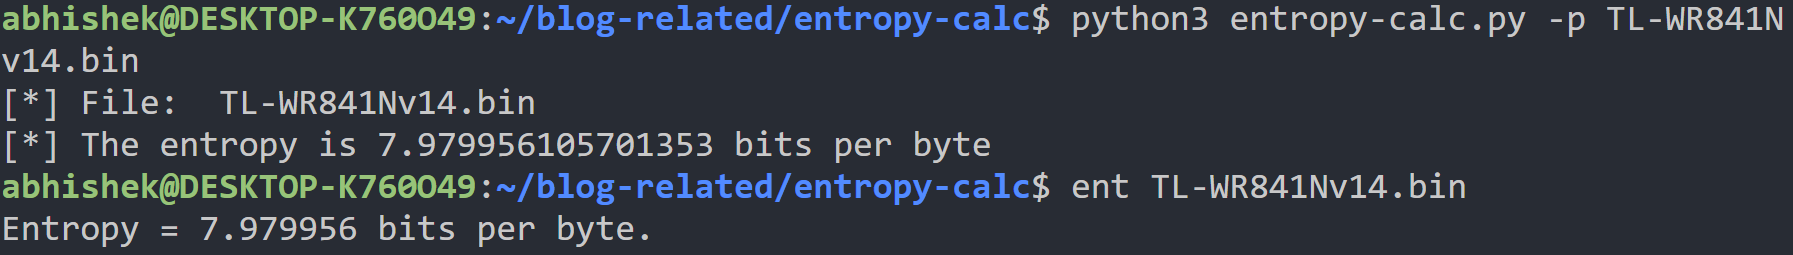
Running the above function with the input as one of TP Link’s router firmware (TL-WR841Nv14), we get the following output. We can see in the same image that the value is correct by looking at the output from fourmilab’s ENT.
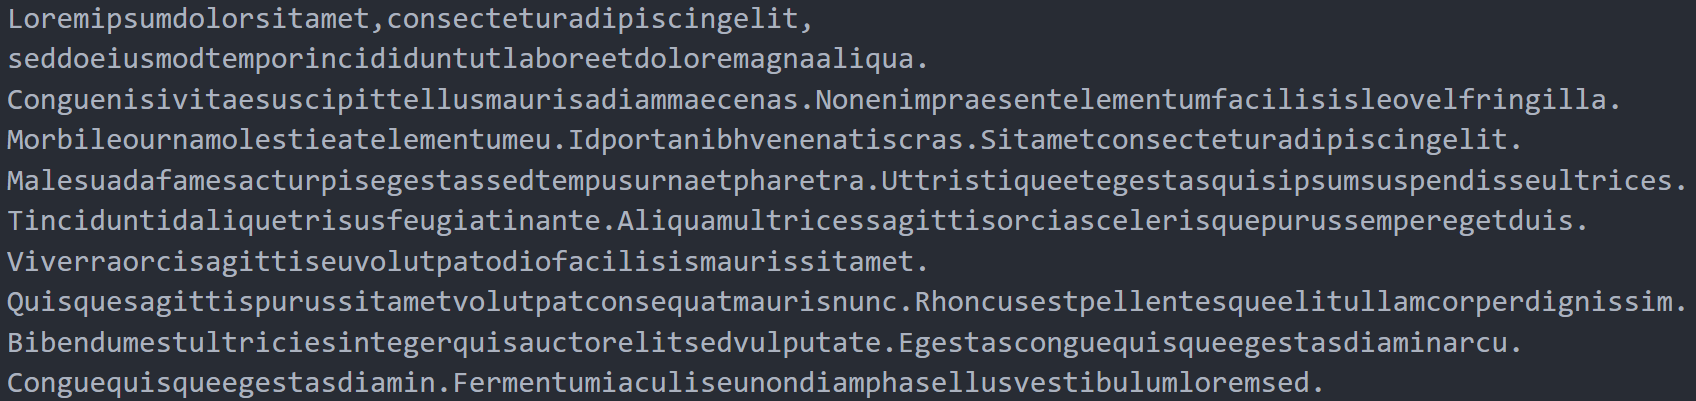
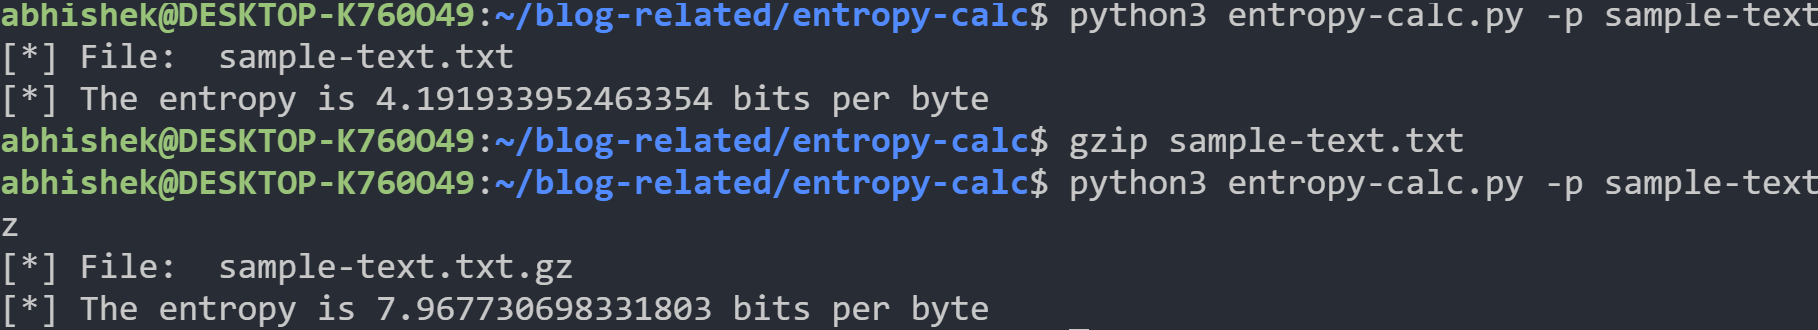
Also, to show that compressed or encrypted data have much higher entropy, we run the same code on sample-text.txt which contains fifty paragraphs of random text from an online text generator.
The entropy of the file and the compressed file is shown below.
Now, to identify regions of higher entropy in between files, we add the following python function.
def chunk_wise_entropy(file_data):
  entropy_chunk = []
  offset_chunk = []

  counter = 0
  data_len = len(file_data)
  if file_data:
    while counter <= data_len:
      entropy_chunk.append(information_entropy(file_data[counter:counter+CHUNK_SIZE]))
      offset_chunk.append(counter)
      counter += CHUNK_SIZE

  plot_entropy(entropy_chunk, offset_chunk)
The above function divides the entire file into chunks of the specified size and calculates the entropy for each chunk. Each chunk’s entropy is stored in a list which we can use to plot the region based entropy.
Results
Calculating the entropy of each chunk of the file helps us identify regions in the file where there might be compressed or encrypted data. To test this, I have put the compressed text file between the uncompressed file in the manner shown below.
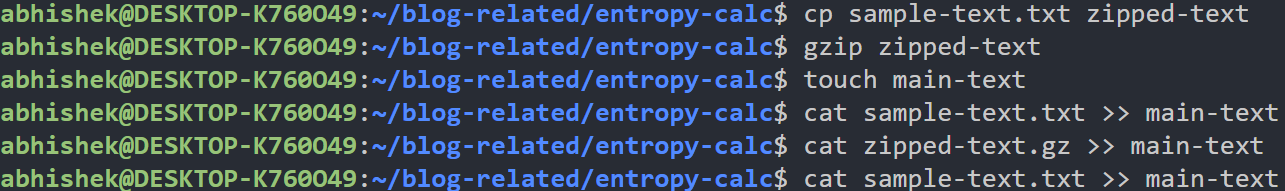
On running the script on main-test, we get the following result.
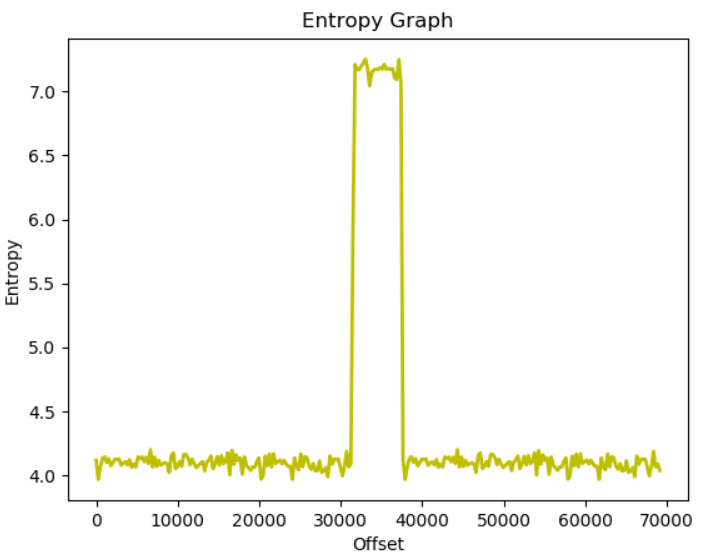
We can very clearly distinguish the compressed region by looking at the region with the high entropy. This is because the file main-test has contents in the order sample-text | compressed-text | sample-text. Since the compressed text is in between the file, the region in the middle has a much higher entropy when compared to the rest.
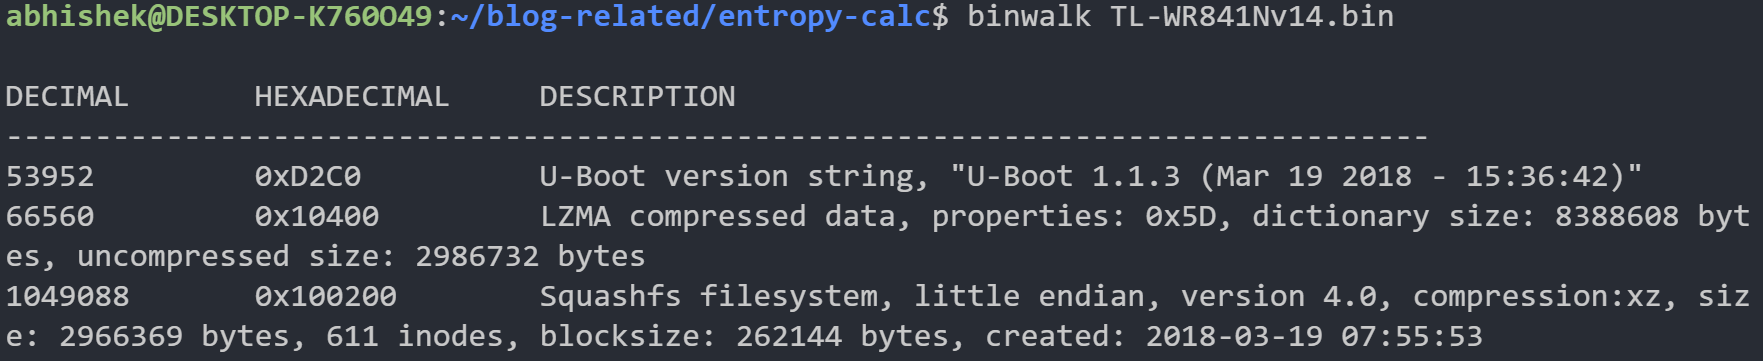
Testing this on TP Link’s firmware, we get the following result.
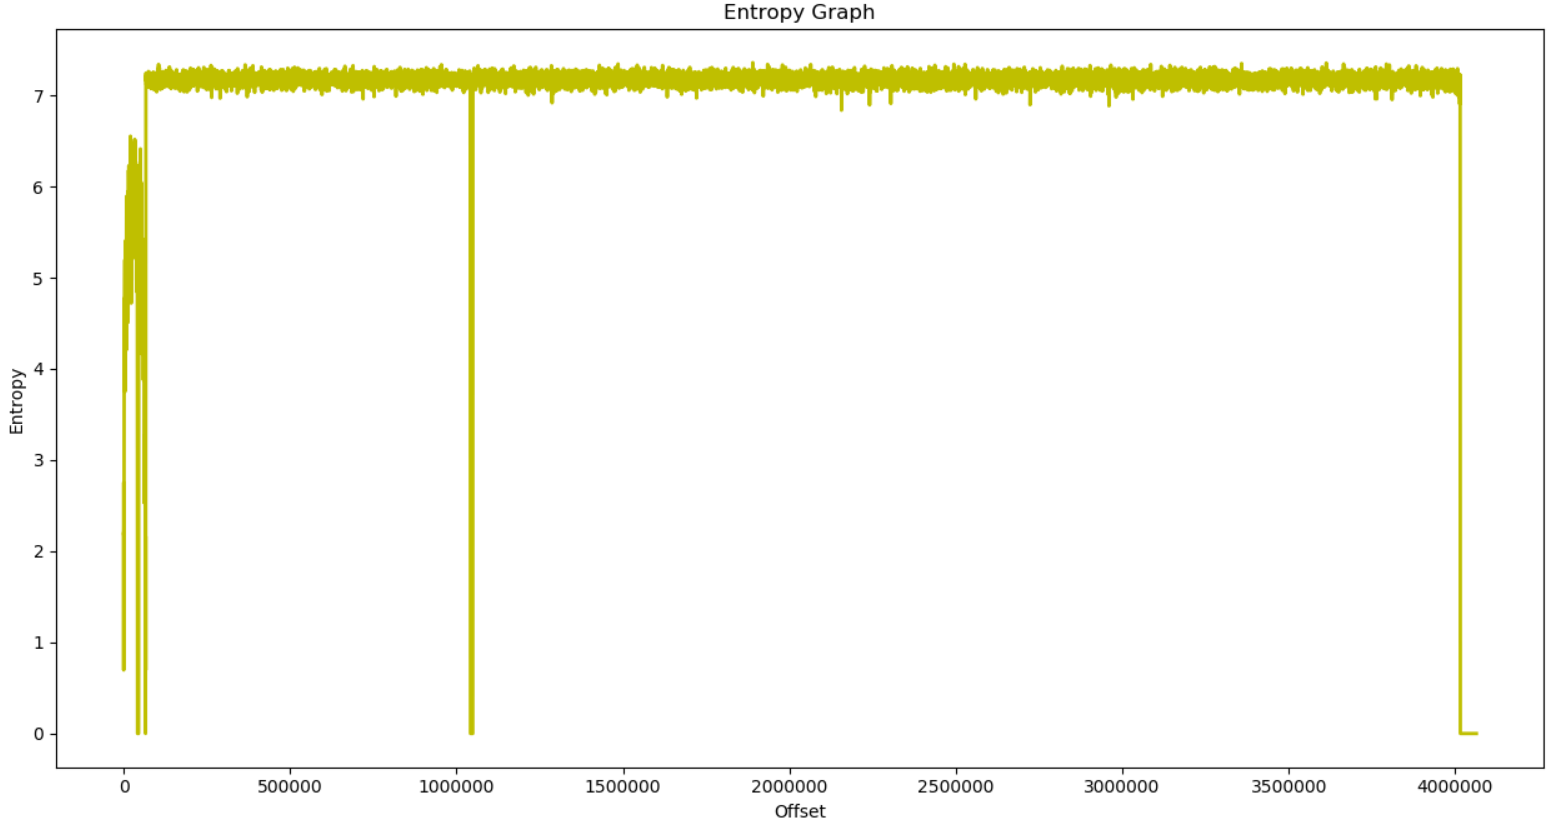
Looking at binwalk’s results (shown below) and the above image, we can see that at the start of the headers, there is a drop in the entropy (eg. after 1000000) and then a sharp rise in entropy for the compressed regions. In this manner, we can identify the compressed and encrypted regions of most files.
To test your files, you can get the entire code from my github page.
Another Application
Most malware, to avoid AV detection, encrypt most of their code with just the unpacker left alone so that it can, during run time, decrypt the file and load it. By calculating the region based entropy and comparing it with existing samples, we can quickly classify malware. This is the basis for SARVAM, which is a fast malware classifier.
That’s it for this post. Please let me know what you think.